This page features some examples of my professional work as a transportation engineer; my specialty is implementing projects to improve transit operations on city streets. I currently work at King County Metro, on in a team called Speed & Reliability. As the team name suggests, our goal is to make buses run faster and more consistently, creating a better rider experience and more efficient use of operating funds. This is accomplished several ways: We manage projects to install a series of improvements along a bus route or corridor, we design and operate systems that detect buses and give them green lights at traffic signals (this is called Transit Signal Priority, see below), we work with cities when they are rebuilding roadways to make sure that the new designs will work for buses, we provide recommendations to transit planning and scheduling staff about better ways to run the buses, and we also try to fix traffic problems reported by bus drivers. If you regularly ride buses anywhere in King County, you undoubtedly benefit from some of my work.
This portfolio is split into four parts, first are some examples of my projects that you can see and experience as you travel around King County, sorted by type of improvement, then I have a collection of presentations and papers that I have prepared for various academic forums, followed by some tools & spreadsheets that I have created and are available for download, and finally some selected works from my graduate and undergraduate studies at the University of Washington are featured. I have attempted to write this page to be understandable by the general public, however my papers and presentations available for download are fairly technical, for those that would like to know more detail.
Transit Priority Treatments and Implemented Projects
Transit Queue Jump Signals
A queue jump is basically a special bus signal that gives buses a head start at a traffic signal and allows the bus to "jump" ahead of queued traffic. There are quite a number of these installed throughout Seattle and King County. Here are a few examples of queue jumps that I have had at least some involvement in implementing. Follow the link to Google Maps or Street View where you can take a virtual tour of these installations:- 4th Ave & Madison St, northbound direction [street view]
- Pike St & 6th Ave, eastbound direction [street view]
- Rainier Ave S & S Dearborn St, southbound from left lane [street view]
- Spring St & 6th Ave, eastbound direction [street view]
- 23rd Ave E & E Madison St, southbound direction [street view]
- Westlake Ave N & N Harrison St, northbound direction [street view]
- Westlake Ave N & N Mercer St, northbound from left lane [street view]
- 1st Ave N & Denny Way, northbound through and left turn [street view]
- W Mercer St & 3rd Ave W, eastbound direction [street view]
- NE 45th St & 7th Ave NE (I-5 NB ramps), eastbound direction [map]
- N 45th St & Wallingford Ave N, westbound direction [map]
- Phinney Ave N & N 65th St, northbound direction [map]
- N 38th St & Bridge Way N, northbound left turn [map]
- Columbia St & 2nd Ave, westbound direction [map]
- Columbia St & 1st Ave, westbound direction [map]
Bus Lanes
The concept of a bus lane is fairly straightforward: a special lane that only buses are allowed to use. The purpose of a bus lane is to allow higher capacity vehicles (buses) bypass areas that are congested with lower-capacity vehicles (cars). There are several varieties of bus lanes that differ slightly in the way that they operate:- A Bus-Only Lane is exclusively for the use of buses, all the time, no other traffic may use the lane.
- A Right-turn and Bus Lane is a type of lane that is shared between right-turning traffic and buses making a through movement.
- A Peak Period Bus Lane is a part-time bus lane only in effect during AM or PM peak hours, generally parking is allowed during off-peak hours.
- A Business Access and Transit Lane (BAT Lane) is for the use of buses and traffic turning into business driveways.
- A Bus Pullout is not really a bus lane, but they are often marked and signed similar to a bus-only lane. A bus pullout is intended to allow a bus to stop without blocking traffic, it does not really help the speed and reliability of the bus.
- Denny Way between Fairview Ave and Stewart St; eastbound bus lane [map]
- Blanchard St between 3rd Ave and Westlake Ave; eastbound bus lane [map]
- Westlake Ave N between Stewart St and N Mercer St; bus and streetcar lane [map]
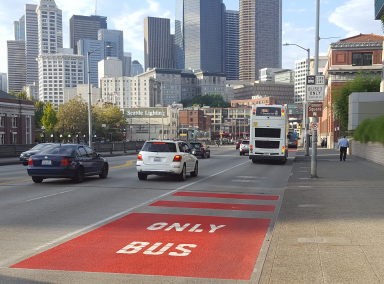
- Spring St between 3rd Ave and 6th Ave; bus lane with red marking [street view]
- Aurora Ave N between N 38th St and N 200th St; peak period bus lane [map]
- Battery and Wall Streets; bus-only lanes [map]
- 4th Avenue S between S Royal Brougham Way and Washington Street; peak period bus lane [map]
- Avalon Way approaching the West Seattle Bridge; peak period bus lane [map]
Bus Bulbs
A bus bulb is an extension of the sidewalk into the street at a bus stop. A bus bulb can accomplish three things: 1: Allows the bus to easily get in and out of the bus stop without having to pull in and out of traffic, in particular saving time related to re-entering traffic. 2: Give the bus a more-favorable queue position at downstream intersections due to other vehicles having to wait behind the bus. 3: Provide more space for bus stop amenities such as shelters, benches, and real-time arrival screens. If you are driving a car you may be annoyed by these bulbs when you have to wait a few seconds behind a bus while the (up to) 60 people on the bus subsequently save time. Here are some bus bulbs that I have worked on:- John St, Thomas St, and Olive Way on Capitol Hill; six bus bulbs installed as part of the Route 8 Speed and Reliability project and in partnership with a City of Seattle Neighborhood Street Fund project.
- N/NE 45th Street between Stone Way and Thackeray Ave; four bus bulbs installed in partnership with a roadway repaving project
Traffic Signal Modifications
Traffic signals can be a significant source of delay for buses. Sometimes the traffic signal can be re-timed or reconfigured to help bus operations. In some cases, a special signal phase for buses can be installed to allow buses to make specific movements through an intersection. Cities usually do a good job in keeping their traffic signals maintained and operating efficiently, but sometimes they need a little hint about where buses are having problems and where there are opportunities for improvement. Reducing bus delay saves Metro money, so Metro can often justify giving the city some money to fix a problem or make an improvement.
Signal improvements may not be as obvious to the average roadway user or bus rider as other types of transit priority improvements, like queue jumps and bus lanes, but users certainly notice when there are problems. Here are some of the more significant traffic signal improvements that I have worked on:
- 4th Ave & Pike St; right-turn signal phase for buses turning right onto Pike St [street view]
- Aurora Ave & N 46th St; bus-only signal that operates like a ramp meter [street view]
- Fairview Ave N & N Valley St; bus-only signal for westbound movement [street view]
- Broadway & E Pine Street; new protected-permissive left turn phase for EBL movement [map]
- Beacon Ave S & S McClellan St; reconfigure signal to allow concurrent north-south movement [map]
- 25th Ave NE & Pend Orille Way; new protected-permissive left turn phase for EBL movement [map]
- Northgate Transit Center & N 100th St; bus-activated protected-permissive left turn phase for EBL movement [map]
- Campus Parkway & University Way NE; change order of phases so that bus doesn't get trapped between the WB and EB intersections [map]
Transit Signal Priority
Transit Signal Priority (TSP) is a technology that gives transit vehicles preferential treatment at traffic signals, basically giving more green lights to buses. King County buses have a GPS-based on-board location system that initiates TSP requests as the bus approaches a TSP-equipped intersection, and then the request is sent over a 4.9GHz wireless network system to the traffic signal controller. My work includes recommending where TSP should be installed, negotiating the TSP timing strategies with the city, and planning for a centralized next-generation system. Here are the locations or corridors where Metro is currently running TSP; I have been involved in all of these installations to some degree:Bus Stop Consolidation
Bus Stop Consolidation is a project to evaluate all of the bus stops along an existing bus route and close or move selected stops in order to reduce the total number of stops along the route. The primary goal of a bus stop consolidation project is to reduce the travel time and improve reliability of the route as a whole. Other benefits of bus stop consolidation include reducing the number of bus stops needed to clean/maintain, possibility of adding features like benches and shelters since more riders are concentrated at fewer stops, offering a smoother ride to passengers, and sometimes improved traffic flow along the street.
Bus Stop Consolidation projects tend to involve a lot of community outreach and are labor intensive projects. Although bus riders in general are supportive of fewer bus stops (based on surveys conducted by Metro), those people that are negatively impacted by a bus stop change often offer strong complaints. My graduate thesis project [linked below] was a thorough discussion and analysis of a bus stop consolidation project along Metro's Route 48 that I conducted in 2002-2003. Over the course of a year, I evaluated most of the bus stops along the route, and closed about 40 of them. I had to take feedback and form a consensus among bus drivers, commuters, elderly folks, other transit agencies, persons in wheelchairs, city officials, blind-deaf individuals, non-English speaking immigrants, irate property owners, and high school vice-principals.
Since the Route 48 project, I have been only peripherally involved in other bus stop consolidation projects that Metro has since embarked upon (or, "bus stop spacing projects", as they are called now), but my Route 48 project had laid the groundwork for the process that was largely followed in the later projects.
Pay on Entry Simulations (a.k.a. Ride Free Area Elimination)
Oh, the good old days when you could take any bus for free within Downtown Seattle. The Ride Free Area (RFA) was a perk enjoyed by residents and visitors to Seattle since its inception in 1973 until its demise in Fall 2012. While popular with some riders, the RFA cost about $2 million per year to operate, resulted in an awkward fare structure throughout the Metro system (remember pay on exit?), and was despised by bus drivers due to the frequent use of buses by persons for non-transportation purposes. Part of the reason that the RFA was maintained for so long was that it was often cited as critical for maintaining bus throughput and reliability through Downtown Seattle. Metro management feared that getting rid of the RFA would result in backups and gridlock throughout Downtown. This came to the forefront of attention in 2010 when an audit of Metro highlighted the cost to operate the RFA, and Metro was suffering from declining revenue and facing potential service cuts.
One day around this time, the Deputy General Manager stopped by my office, made himself comfortable in my spare chair, and wondered aloud if and how it would be possible to somehow do a real live test or simulation of downtown bus operations without the RFA, to see if and how bad delays would become with everyone having to board through the front door and pay a fare. Next thing I know, our team has a new assignment: designing and conducting a series of "Pay-on-Entry" simulations. My job was to amass an army of volunteers to count passengers, run stopwatches, and purposefully delay buses at bus stops during a weekday PM commute to simulate what would happen if everyone had to board through the front door and pay a fare upon entry. I also was responsible for determining how long we should hold buses based on the number of boardings, then attempting to draw conclusions based on the data that was collected during the simulations.
These simulations were run on 2nd, 3rd and 4th Avenues, a few spot locations, and the Downtown Seattle Transit Tunnel. 2nd & 4th Avenues worked okay with the added delay. 3rd Avenue was borderline okay, workable with a few minor improvements. The tunnel, however, got completely gridlocked during the simulation and needed a series of significant improvements and a reduction in the volume of buses scheduled during the PM peak. These adjustments were implemented and the Ride Free Area was discontinued in September 2012 with overall bus travel times remaining constant or even improving in some cases. Sorry!
Pedestrian Congestion Study
When the Downtown Seattle Bus Tunnel was scheduled to be closed for a 2-year period, there was a big concern among downtown interests that the surface bus stops would become overcrowded. To address this issue, it was decided that a pedestrian congestion study would be conducted before, during, and after the tunnel closure. This project was placed in my lap without much direction as to how one would go about measuring "pedestrian congestion." So I started by reviewing some relevant national research, then I worked with my co-workers and a consultant to devise a method for measuring pedestrian level-of-service for walkways and for queuing/waiting areas. With this, we sent out an army of data collectors (UW students) to the busiest downtown bus stops to count the number of people waiting at each stop in 5-minute intervals, and the number of people walking on the sidewalk through the bus stop area.
After the initial data came in and we ran some calculations, one thing became apparent: Seattleites like their space and will adjust themselves to achieve their preferred berth. The national pedestrian level-of service criteria seemed to be based on east coast standards, and the pedestrian density that we measured in downtown Seattle (measured in peds/ft2) barely even tipped the scales of the A through F level-of-service criteria. So, we had to come up with our own pedestrian congestion criteria in order to make any meaningful comparisons.
The pedestrian congestion study results went into a larger Tunnel Conversion Performance Report, which was issued periodically during the tunnel closure project.
Presentations & Papers
Title: Traffic Engineering for Transit Operations; Improving Speed & Reliability
Year: 2018
Venue: University of Washington; Seattle, WA
Download links: [PowerPoint PPSX file] | [PDF File]
For several years, Professor Scott Rutherford asked me to be a guest speaker for his Transit Planning class, CEE 589, at the University of Washington. The presentation I have created for this class covers several topics including various traffic engineering tools to improve Transit Speed & Reliability, Transit Signal Priority, Bus Stop Consolidation, and other current events. This presentation has evolved over the years, and the latest version is available for download via the above links. It is also lengthy, designed to fill a 90-minute class.
Unfortunately, the University has discontinued this class in 2018, so this may be the final update to this presentation.
Title: Everything but the Kitchen Sink: King County and SDOT's Improvements in Speed & Reliability on Route 8
Year: 2018
Venue: American Public Transit Association Sustainability & Multimodal Planning Workshop; Vancouver, BC
Download links: [PowerPoint PPSX file] | [PDF File]
I collaborated with a colleague from SDOT both on the Route 8 corridor project and on this presentation. The presentation highlights the results of a speed & reliability project for Metro's Route 8, which I managed over a 3-year period. The corridor project comprised of a variety of small improvements all along the route.
Title: Transit Performance Measures (and how to improve them)
Year: 2017
Venue: ITS Washington Annual Conference; Seattle, WA
Download links: [PowerPoint PPSX file] | [PDF File]
A brief look into how bus speed & reliability is measured, why it is important, and how transit speed & reliability projects are evaluated.
Title: Moving people; prioritizing transit
Year: 2016
Venue: Institute of Transportation Engineers; Anaheim, CA
Download links: [PowerPoint PPSX file] | [PDF File]
I collaborated with a colleague from SDOT on this presentation given at the 2016 ITE Annual Conference. It showcases a series of transit-supportive traffic improvements installed in the South Lake Union neighborhood when the RapidRide C-Line was extended to serve the neighborhood. This project was funded by the City of Seattle but required a close partnership between Metro and Seattle.
Title: Third Avenue Skip-Stop Operations; Now a Rainbow of Frequent, Efficient Service
Year: 2011
Venue: American Public Transit Association Intermodal Operations Workshop; Seattle, WA
Download links: [PowerPoint PPSX file] | [PDF File]
This presentation is a discussion of bus stop capacity analysis and scenario development in preparation for the February 2011 Service Change, when many routes were moved from First to Third Avenue in Downtown Seattle. A new skip-stop color pattern was developed in order to accommodate the additional bus volumes on 3rd Avenue.
Title: The Downtown Seattle Bus Monitoring System; Collecting and Analyzing Transit Travel Time Data
Year: 2011
Venue: ITS Annual Meeting, Bellevue, WA
Download links: [PowerPoint PPSX file] | [PDF File]
This presentation is a discussion of a travel time monitoring system that was developed to track bus speed & reliability over the course of the Alaskan Way Viaduct replacement project. The presentation covers the hardware installation, methods of data processing and reporting, and shows some examples of the system in action.
Title: The Downtown Seattle Bus Monitoring System; A New Way of Collecting and Analyzing Transit Travel Time Data
Year: 2010
Venue: American Public Transit Association Intermodal Operations Workshop; New York, NY
This presentation was an earlier version of the presentation featured above. The later version is a better summary of the same topic, so I don't have it posted it here for download.
Title: Bus Stop & Bus Lane Capacity; Planning Bus Routes in Downtown Seattle
Year: 2007
Venue: American Public Transit Association Intermodal Operations Workshop; San Francisco, CA
Download links: [PowerPoint PPS file] | [PDF File]
This presentation describes a method for calculating bus stop and bus lane capacity based on methods presented in the Transit Cooperative Research Program's Transit Capacity & Quality of Service Manual. The presentation describes how we developed a user-friendly spreadsheet for implementing the calculations and used it to decide how many buses to schedule onto 3rd Avenue in Downtown Seattle in 2007 when the transit tunnel reopened after a 2-year closure. The desire was to put as many buses as possible on 3rd Avenue to take advantage of the transit priority treatments that were in place on that street, but not too many buses that would overload the bus stops.
Title: Transit Signal Priority on the Cheap; A solution to reduce bus delay at a Park & Ride in Bellevue, WA
Year: 2006
Venue: Institute of Transportation Engineers, Transit Council, call for papers
Download links: [PDF File]
If you ever take the Sound Transit route 550 from Bellevue to Downtown Seattle, your bus will pass through the South Bellevue P&R. This park and ride used to be a major source of delay to the 550, and a few other routes, because of the heavy volume of traffic on Bellevue Way and the traffic signal at the P&R exit. The paper discusses a unique transit signal priority (TSP) system that significantly reduced the delay to southbound buses as they enter and exit the Park & Ride. The transit priority system is unique because it uses a couple of strategically-placed loop detectors to detect buses. There are also three bright blue LED indicator lights that illuminate when a bus is detected, in order to provide positive feedback to bus drivers.
Academic Work (1999-2004)
Effects of Bus Stop Consolidation on Transit Speed and Reliability: A Test Case
Like many transit agencies in the U.S., Metro has too many bus stops on most of its routes, which slows transit service and is an inefficient use of resources. This work discusses a bus stop consolidation project that I managed on the King County Metro route 48, and provides an analysis of the results. This was my master's thesis completed in March 2004. Watch out, it's 55 pages long.
Economics of Truck and Rail Freight Transportation: A look at public and external costs and the truck-rail modal split.
This was my final paper for class CEE 591, Freight Transportation. This paper compared the costs associated with rail and truck shipping, focusing on the costs that are not directly imposed on the user, such as highway maintenance and the impacts of pollution. Some recommendations were made for controlling these so-called external costs, in order to minimize the costs to society resulting from freight transportation. Economic elasticities were used to predict the impacts that would result from internalizing these external costs.
Psychological Pollution: Thinking beyond emissions.
This was my final paper for URBDP 498B, Transportation and the Environment. This paper is a unique look at some of the social impacts of automobile dependence. It delves into such topics as American car culture, day-to-day driver interactions, effects on land use, privatization of society, and corporate interests. Some may not agree with the ideas or conclusions presented in this paper, admittedly it is fairly subjective, but I think it deserves at least a look.
Biodiversity in a Suburban Environment.
This paper looks at some of the environmental impacts of urban sprawl on local biodiveristy, with special emphasis on water quality and hydrological effects. This was my final paper for CEE 350, Environmental Engineering.
Previous Work Experience
Before I worked at Metro, I worked for Gibson Traffic Consultants, a small traffic engineering consulting firm located in Everett, WA. A notable project there was measuring new clearance intervals for every single traffic signal in the City of Everett. Clearance intervals include the Yellow Time, All-Red Time, and Flashing Don't Walk (FDW) Time that are programmed into the signal controller. The clearance intervals are based on the intersection geometrics, observed vehicle speeds and pedestrian walking speed, and were calculated to the tenth of a second using formulas recommended by the Institute of Transportation Engineers.